Survey Mechanics
This project was framed with the full knowledge that it was an information-gathering exercise, as opposed to a rigorous information science study. Respondents self-declared demographic information and were often asked to select “all that apply” for informational questions.
The survey was run using Google Forms, not requiring personal identification of respondents. The first choice respondents had to make was whether to fill out the “Individual Contributor” (IC) survey or the “Decision Maker” (DM). Several questions overlapped, but it was logistically unwieldy to create one survey that would fit both. It would have meant too many questions outright, several of which were not applicable to one or other group. In fact, respondents to either form were invited to fill out the other, if applicable, but it’s not clear that anyone did.
Advertising
In the din of today’s online world, there are always organizations you don’t know that are clamoring for your time and attention. Getting people to pause and share their thoughts in a questionnaire can be challenging.
Rather than engaging in an email blast to get the survey request to as many mailboxes as possible, advertising of the survey project was deliberately grass-roots, reaching out to operators where they work. It started with a lightning talk at NANOG 76 in Washington, DC, in June 2019. Once the questionnaire was open for respondents, it was introduced in a brief talk at the RIPE Open Source WG in Rotterdam in October 2019, a posting on the NANOG mailing list, and helpful boosts from social media influencers in the tech space.
As a result, the POSSIE survey website got 260 views in October and November, 180 of which included viewing the survey introduction/links page on the site.
Responses
With that, the final tally of responses exceeded project targets, receiving a total of 48 responses:
- 34 responses for the Individual Contributor questionnaire
- 14 responses for the Decision Maker questionnaire
No prize was offered for completing the survey. From informal conversations, it seems that people were genuinely interested in the outcome of the survey, and therefore willing to contribute their thoughts.
This is a higher response rate than was originally projected for the project, and we appreciate the time people took to fill out the questionnaire!
Demographics
Finally, on to some data! Future posts will dig into the material responses to what respondents do for and with OSS, but first, some information about who the respondents were.
Respondents’ employment sectors
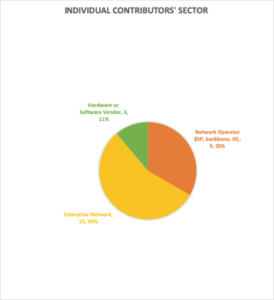
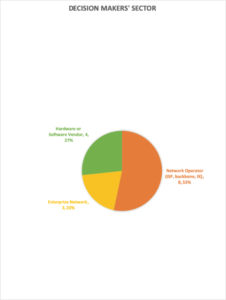
Both Individual Contributor and Decision Maker respondents primarily came from operations backgrounds.

Individual Contributors primarily identified as being from Enterprise Networks operations, although a third said they were from more general Network Operator backgrounds.
The split was somewhat the other way for Decision Makers, with the majority identifying with Network Operator backgrounds, and a significant portion saying they were from Enterprise Networks.

Respondents’ roles
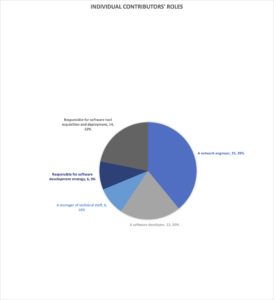
The bulk of Individual Contributor respondents identified themselves as network engineers. Eight of them also identified as software developers (of which there were 13, overall).

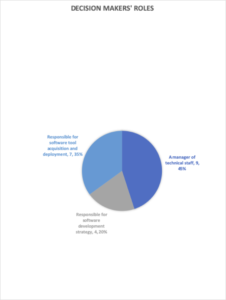
Nearly half the Decision Makers reported that they managed technical staff (potential contributors to OSS projects). A third identified as being responsible for software tool acquisition and deployment (potential OSS use), and one fifth said they were responsible for software development strategy.

Looking for feedback!
What can we make clearer in this part of the report? What other questions does this bring to mind that we should answer?
Send comments in mail to: ldaigle@thinkingcat.com
